Your Monday Dirty Dozen [CHART PACK] #21
As an alternative approach, one of the traders I know does very well in the stock index markets by trying to figure out how the stock market can hurt the most traders. It seems to work for him. ~ Bruce Kovner
Good morning!In this week’s Dirty Dozen [CHART PACK] we look at positioning in the options market versus direct, then we explore the possibility of the SPX entering an extended trading range, followed by good looking charts in precious metals as well as a few stocks, before ending with fiscal and US confidence. Let’s dive in…
SUBSCRIBE TO THE MONDAY DIRTY DOZEN HERE
***click charts to enlarge***
- There seems to be a major discrepancy in the positioning data. Data for both retail and institutions show that naked positioning is pretty neutral or in the case of this chart from Nomura, slightly net short.
- But then you have charts like this which show that for only the fourth time in history, “Investors have gotten extraordinarily (and mechanically) long the market via options and the overall index trade to ATH, with Delta across the S&P 500 currently in the 99.5th percentile” according to Nomura’s Charlie McElligott (h/t Andrew Thrasher).
- It appears that all the bullish speculation has moved into the options market where both retail and pros are buying calls as fast as they can get them, while their direct exposure remains limited. I’m guessing the majority of the market came into Oct/Nov when this rally started with an extremely light book due to recession fears and they’ve since resorted to speculative call buying over the last month to try and performance chase. This chart from Goldman Sachs shows that single stock option notional volumes as a percentage of shares are at 91%. It’s highest level ever.
- Knowing that there’s been widespread call buying then, like Kovner says above we have to ask ourselves “what could the market do that would hurt the most traders right now”. To which, the answer is a period of sideways chop that makes all these calls expire worthless. The chart below of the SPX shows that it’s up against 2-month resistance, its upper Bollinger Band, and may be forming a sideways trading range — I should point out though that this market has bought into every single little dip, so momentum still favors more upside. This is just one scenario I’m gaming. It becomes less likely should the SPX break above that upper resistance.
- Considering the above along with the growing coronavirus fears, I re-upped my position in long bonds again on Friday. The technicals look good and give us a good hedge to our long book. ZB_F is close to breaking out of a bullish wedge at the moment.
- And if bonds do rally from here (yields fall) then precious metals should break out of their recent consolidation. The long-term chart (monthly) for silver is really shaping up nicely. It’s put in a double bottom and is forming a long rectangular base. I’d be a buyer if/when it breaks above its recent range.
- Precious metals have surprised quite a few people by staying bid in the face of the strong rally in the dollar (DXY). The trade-weighted dollar is comprised mostly of the euro (roughly 60%). In FX, hardly do gaps go left unfilled… This daily chart of EURUSD shows the euro is working hard to close its gap from back in April 2017.
- While the short-term technicals don’t look great for EURUSD, the longer-term fundamentals are becoming more supportive of a bottom in the near future. Rate differentials have been moving up in the euro’s favor over the last 14-months. US/DM rate convergence is one of my higher conviction themes this year. It’s one reason why I bought Deutsche Bank (DB) in early Jan.
- I don’t typically buy stocks as plays on “events” like the coronavirus. Gilead (GILD) the pharma stock would fit that bill. It has a drug called remdesivir that has been shown to be effective against the nCov class of viruses. I’m considering making an exception here because the technicals on the chart look sharp. It might be a good DOTM candidate to take as a flyer (size position small).
- A while back, I want to say early 17’ sometime, I wrote up a report on Fairfax India (FIH.U). It’s a holding company that holds some great assets in India. It’s run by Prem Watsa, the “Canadian Warren Buffett”, and sells at a 30%+ discount to its NAV. Well, despite the continued growth in its NAV, the stock hasn’t gone anywhere. I don’t have a position but I do keep a close eye on it. I think it’s only a matter of time until the market wakes up to the value on offfer here. Chris Mayer wrote about it recently, which you can find here.
- There’s growing talk about the need for fiscal stimulus in this world. Bloomberg put together a chart showing the 5-year projected debt profiles of DM countries. The ones at the top are mostly European countries. Seems they have a lot of room to get fiscal should Germany ever loosen its stranglehold on the purse strings.
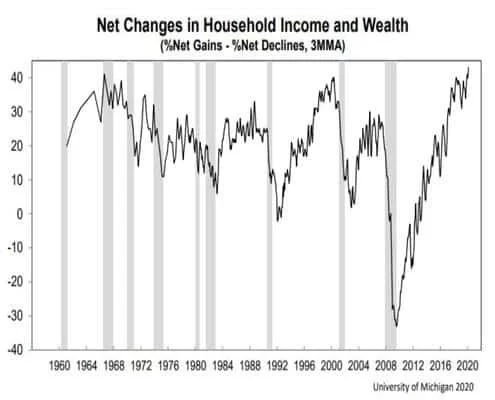
- The recent University of Michigan’s Confidence Report shows that American’s are quite optimistic. According to the report “Net gains in household income and wealth were reported more frequently in early February than at any prior time since 1960” when the school began collective data. If this keeps up going into November, whoever the Dem candidate is will have quite a difficult time usurping the incumbent Trump.


