Your Monday Dirty Dozen [CHART PACK] #20
Try as one might, when one looks into the future, there is no such thing as 'complete' information, much less a 'complete' forecast. As a consequence, I have found that the fastest way to an effective forecast is often through a sequence of lousy forecasts. ~ Paul Saffo
Good morning!In this week’s Dirty Dozen [CHART PACK] we look at buy climaxes, wild speculation, some strangely muted sentiment, and positioning data, then get into virus growth rates and finish with a Russian tech giant breaking out of a huge base….
***click charts to enlarge***
- “A LESSON ON THE PUT/CALL RATIO AND WHY IT'S TELLING US THAT TRUMP WILL GET THE CORONAVIRUS :).” ~ Jesse Stine
- I’ve been highlighting the extreme put/call readings for the last few weeks. But here’s the thing about buy climaxes… They last longer than anyone expects them to. Momentum like that which we’re seeing in the FAMG stocks is a helluva force to try and fade. This weekly log chart of MSFT shows that its parabola is now in the straight vertical climb phase. MSFT has climbed the ranks to become the fourth most popular stock held by retail on the Robinhood app, right behind the cannabis stock ACB, Ford, and GE.
- Retail speculation is driving a buying frenzy in a number of stocks. The most notable being Tesla (TSLA) which turned over $169bn, that’s billion with a B, in trading the other week (marked by the green line). That’s more than the weekly traded value of MSFT, AMZN, and GOOGL at any time in their history which is saying something since those stocks are 10x the size of TSLA.
- Bitcoin (BTCUSD) is looking like it wants to join in on the fun. The cryptocurrency just closed above the 10k level which has previously acted as significant resistance (chart below is a monthly). The odds now favor BTC taking out its 19’ highs in the coming months.
- While we’re definitely seeing pockets of bubbly activity in select stocks and amongst some retail investors, the general sentiment is elevated but less so than it was a couple of weeks ago (chart via Nomura).
- And if you’re looking at CoT Speculative positioning the numbers are even less impressive. Spec positioning in the SPX remains quite muted while AAII Bulls are back in neutral territory after last week’s di — we should not be surprised if the market rips higher from here…
- While short-term traders have been quick to pile into bonds (chart via Nomura).
- No doubt the coronavirus is keeping a lid on the bullish fervor somewhat. Here’s the recent growth rates for the virus via @Trinhnomics. While confirmed cases continue to trend higher, the rate at which it’s growing appears to be slowing.
- Here’s some Chinese GDP gaming from Nomura given five different scenarios regarding the termination of lockdown measures. From where I’m sitting, the end of February seems a little too on the optimistic side but who knows.
- I thought this was an interesting set of charts from Credit Suisse. They show the aggregate free cash flow minus buyback/dividend yield of the SPX ex financials. They note that US corporations often go in the hole (deficit spend) in the lead up to recessions. US companies were briefly in deficit last year but are back to being slightly in the green.
- The NYSE stock only advance/decline line (red) is diverging from the SPX (black). Keep an eye on this. It doesn’t mean a top is coming, it just notes a serious weakening of the trend in breadth which makes the market more susceptible to a larger selloff if it continues.
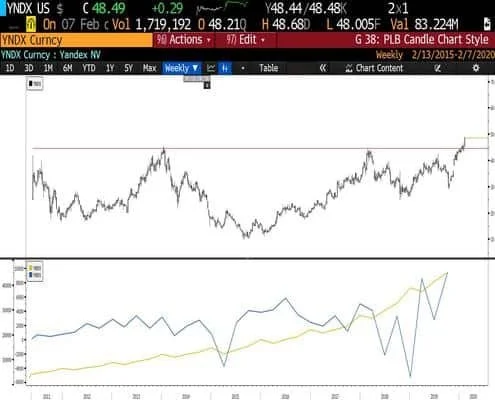
- Despite the pockets of crazy in some areas of this market, I’m still finding plenty of opportunities. Take Russian tech giant Yandex (YNDX) for example. It just broke out of the neckline of its 8yr+ inverted H&S. TTM revenues (yellow) and free cash flows (blue) are making new highs and growth is accelerating. The Russian government is about to embark on a multi-year fiscal spending spree. There’s a lot to like here. I’ll be sharing my writeup on the company with Collective members this week.


