Your Monday Dirty Dozen [CHART PACK] #15
...the poker world is so competitive that if you don't fully capitalize on every advantage, you're not going to survive. I absolutely understood that concept by the time I got down to the options floor. I learned more about options trading strategy by playing poker than I did in all my college economics courses combined. ~ Jeff Yass
SUBSCRIBE TO THE MONDAY DIRTY DOZEN HERE
Good morning!In this week’s Dirty Dozen [CHART PACK] we question whether our bearish bonds stance is still valid. We then dive into what falling yields could mean for other areas of the market and go through some charts of gold, silver, and emerging markets. Let’s dive in…
***click charts to enlarge***
- December’s ISM Manufacturing data printed its lowest number in 10-years, remaining in contractionary territory for the fifth straight month. New orders, Production index, and Employment all made new or near cycle lows (the production index squeaked in a slightly lower low in Jan of 16’).
There’s a number of reasons to believe that we’ll soon see this data reverse. For example, Markit’s PMI — which is of higher fidelity — has already bottomed and is trending higher. Also, a number of regional Fed survey data is showing a rosier outlook. Plus, this month was the last month in which the survey was conducted before the tentative trade deal was reached. I’m not expecting a hockey stick rebound like we saw in 16’ but we should see a bottom be put in soon.
- Treasury yields tend to follow the trends in the ISM. This makes sense as a growing economy (rising ISM) usually drives investors to sell bonds and move further out the risk curve and vice-versa. Considering this, the current divergence between the two is interesting.
- It’s possible that the bond market is expecting a swift rebound in the ISM or that it’s just been lagging in response and we should expect higher bonds / lower yields in the weeks ahead. This monthly chart of bond futures ($ZB_F) shows bonds recently put in a micro double-bottom and closed at their highs for December.
- I’ve been bearish on bonds the last few months. One of the reasons why was due to what the metals market was saying with the copper/gold ratio leading yields higher. But this ratio has collapsed in the last few weeks and is on the verge of signaling a new trend lower.
- Another thing that makes me question the continued validity of my bearish bonds stance is how well they’ve held up considering the market’s low volatility grind higher. When something doesn’t sell-off when you expect it to then that’s a signal in and of itself.
This reluctance of yields to move higher (bonds lower) has been a major tailwind for stocks since stocks and bonds compete for capital and higher yields make bonds more attractive on a relative basis.
- These low yields have been keeping financial conditions extremely loose.
- And falling real yields have been driving gold higher (real yields is inverted).
- This monthly chart of gold shows that it’s making an attempt to break out of its 5-month consolidation zone by breaching the $1,550-1,600 area. A significant level that has rejected it twice before.
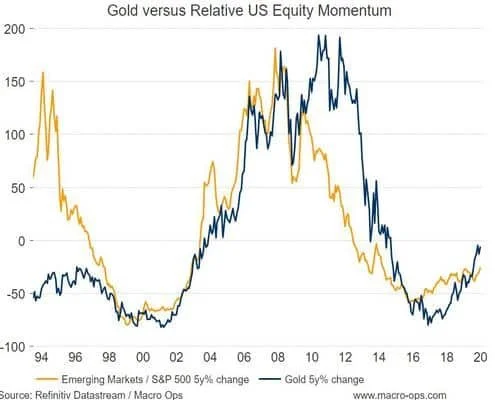
- Falling real yields and rising gold typically go hand in hand with relative outperformance from emerging market stocks. The chart below shows the 5-year change of gold and SPX vs. EEM indices.
- The gold/silver ratio remains extremely elevated. Historically this is bullish for future returns in precious metals, especially silver.
- This monthly chart of silver (SI_F) shows the metal trying to break out of its 5-month long bull flag.
- When looking at miners I care about technicals over everything else since the space is primarily driven by narratives and sentiment. There’s a number of great looking technical setups in gold and silver miners at the moment. Here’s a chart of Silvercrest Metals (SILV) on a weekly basis.


