Why Inflation ISN’T Coming [DIRTY DOZEN]
Thinking in bets starts with recognizing that there are exactly two things that determine how our lives turn out: the quality of our decisions and luck. Learning to recognize the difference between the two is what thinking in bets is all about. ~ Annie Duke via Thinking in Bets
Good morning!In this week’s Dirty Dozen [CHART PACK] we look at US economic news sentiment and dive into what might be behind the divergence between the fundamental narratives and market prices. We then cover the inflation outlook and discuss why the Inflationistas are wrong before jumping into the schizophrenic positioning we’re seeing in the market and how its being driven by Fed policy, plus more…Let’s dive in.
***click charts to enlarge***
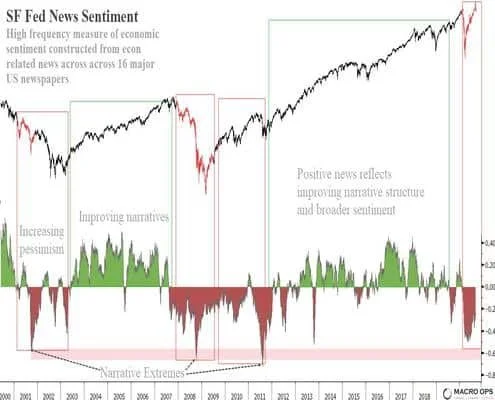
- In last week’s Dozen I shared some studies which showed that measures of journalistic sentiment and narratives are at 80-year lows here in the US. So according to our newspapers we’re living in era that’s worse than those experienced during the depths of WWII. This week I was looking at the San Francisco Fed’s News Sentiment model which they describe as a “high frequency measure of economic sentiment constructed from economic related news across 16 major US newspapers.”
What’s interesting about today is the large divergence between economic news sentiment and markets. The index is more indicative of a continuing bear market — that has yet to hit a sentiment extreme — yet the SPX keeps trucking along.
- The current sentiment and positioning picture is about as schizophrenic as I’ve ever seen it. While retail robinhooders are leveraging and hodl’ing, large hedge funders are sitting in piles of cash. And this Risky vs Safe Fund Flows chart from GS paints a completely different picture than all the talk we’re hearing about “market euphoria”.
- GS’s Risk Appetite Indicator is only back to neutral after hitting its most bearish extreme on record.
- While at the same time, US option positioning is the most bullish in history (chart via GS).
- Citi published a great slide deck last week titled “Investing Under the Money Tree” that attempts to explain some of this phenomenon. First, they point out the futility of average inflation targeting (ait) since it’s not like these bankers have much credibility in that space anyways…
- And the Inflationistas that are pointing to how all the money creation is going to spur inflation should have a look at these charts.
- The author points out that one of the drivers of this disinflationary world is the fact that the majority of our investment goes into scalable sectors (such as IP, software R&D etc…) where prices tend to go down over time, rather than up.
- Instead of credit driving real growth or inflation, it inflates asset prices. This creates an increasingly financialized world where deflationary pressures are actually growing instead of diminishing.
- And so we end up with a schizophrenic market. Where most are bearish because, well, our economic trajectory isn’t great. So they sit in large amounts of cash and safe assets. But… since there’s little to no return on these assets, they’re forced to allocate increasing amounts of their portfolio further out the risk curve. A kind of barbell approach, which is why call options are being bought and we have the “largest long risk ever in the Global CDS market” (chart via BofA).
- This is why the value factor has performed so poorly. In fact, it’s seen its worst 10-year run in history (chart via BofA). Value needs strong nominal growth to outperform.
- BofA points out that “A few key macro variables explain the ongoing mortification of value stocks. The 10-year Treasury yield, the ISM Purchasing Managers Index, and the 5-year forward 5-year inflation breakeven rate account for 79% of the variation in growth vs. value in recent decades.”
According to BofA’s models, “for value to recover its losses this year, Treasury yields would have to rise from 0.7% to 1.8%, PMIs would have to remain in expansion territory, and breakevens would have to rise from 1.9% to 2.5%.”


