Oil At Short-Term Bottom
“The most powerful word in the markets is "despite." If you hear or see a comment like, "Despite the increase in oil inventories being much higher than expected, oil prices closed higher," that is the tape telling you what is going to happen. Everyone saw inventories were much higher than expected. Why did the market close up? The tape knows more than anyone else” ~ Jason Shapiro in Schwager’s Unknown Market Wizards
Good morning! In this week’s Dirty Dozen [CHART PACK] we look at the state of the Hang Seng, global market regimes, creeping weakness in small-caps, and trend exhaustion in large ones, then finish with a look at short-term oversold conditions in oil, plus more...Let’s dive in.
***click charts to enlarge***
- I like to look at our global market regime dashboard every few weeks. It’s a quick way to get a feel for where the action is and isn’t. Each country, market, and asset is grouped by its market regime SQN reading. The countries with the weakest tapes are those with close ties to China.
- Speaking of, the Hang Seng Tech Index has fallen nearly 50% from its highs earlier this year.
- Hang Seng’s book value per share is in a steady uptrend while the price has gone sideways for nearly four years.
- But as the Country Valuation page from our dashboard shows, Hong Kong still isn’t super cheap on a relative or historic basis. And our technical indicators don’t yet show the type of selling exhaustion that marks a major bottom.
- Small caps (RTY) are knocking on the lower bound of their 7-month range while breadth keeps deteriorating.
- Total new 52-week lows of all US stocks are starting to spike for the first time since the March COVID lows. Another sign of growing trend exhaustion.
- The percent of fund managers expecting a stronger economy has rolled from all-time highs, while the percentage of those overweight equities looks like it’ll soon follow suit...
- Large spec positioning in the SPX remains elevated in the 83rd %tile as it enters one of its weakest periods of seasonality.
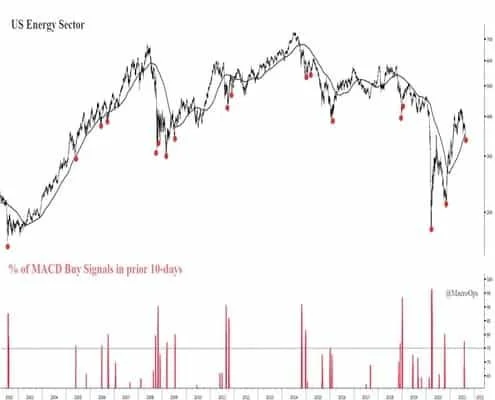
- The Energy Sector saw a MACD Buy Signal trigger last week. This may be good enough for at least a short-term bounce.
- Looking at WTI crude itself, we see a similar picture suggesting crude is at a short-term low. The below backtest shows that its 10-day forward returns have a strong positive bias following six consecutive bear bars while in a neutral regime.
- Looking out longer-term, the energy sector has one of the better forward relative EPS trends of any of the sectors.
- On a totally unrelated note, here’s the breakdown of the total cost of the 20-year US war on terror. $5.4trn dollars spent... and yet we’ve been unable to pass a much-needed sizable infrastructure bill for decades now. The graph is from Adam Tooze’s Chartbook substack, a favorite weekly read of mine. Here’s his summary from that piece (link here).
“The tragedy is not that the War on Terror crowded out better projects. The tragedy is that the better projects were never on the agenda of power at all. The tragedy is that the one thing that those with power and influence could agree on was war-fighting. In a profoundly divided polity, with deep divisions extending into the elite itself, national security is the one area where a degree of bipartisan agreement was still possible.
“Other than making good the damage done by the frailty of the financial system, the War on Terror was by far and away the largest collective undertaking of the United States elite in the last twenty years. That is what the numbers so carefully compiled by the left critics of the war show. It is indictment enough.”
Well put Adam...
 If you enjoy reading these Dirty Dozens each week then please feel free to share them on the Twitters, forward them to a friend, or translate them via smoke signal, etc… Every bit helps us get our name out there. Thanks for reading.Stay safe out there and keep your head on a swivel.


