Monday Dirty Dozen [CHART PACK] #8
Politics is the art of looking for trouble, finding it everywhere, diagnosing it incorrectly, and applying the wrong remedies. ~ Groucho Marx
In this week’s Dirty Dozen [CHART PACK] we look V-shaped, L-shaped, U-Shaped and other alphabetical themed paths for the recovery in growth. We then dive into more fiscal stimulus graphs, look at some indications of growing inflationary pressures, before covering gold drivers, wretched market sentiment and investor flows, and more.Let’s dive in.
***click charts to enlarge***
- BofA wrote in a recent report that “global stabilization of daily case growth rates near 0% (Chart 1) tells us phase 1 of the COVID crisis is over. US daily growth rates have been in the 1%-2% range, a little elevated but well below the 7%-9% daily growth rates of a month ago. Phase 2 started on May 1, as the US began the reopening process.”
- The phase 1 lockdown caused quite the drop in GDP. For all of those assigning various parts of the alphabet to the describe the shape of the coming recovery, Morgan Stanley says there’s only one, writing “If history is a guide, ‘U’ may actually stand for ‘Unicorn’ because U-shaped recoveries coming out of a recession really never happen.”
- I know I keep sharing graphs of the fiscal and monetary response in these pages but I’ve got some more today. The size of the responses to date have been enormous… absolutely gargantuan. Like maybe enough to stop a bear market dead in its tracks kind of size — I’m not saying that’s the case here, just that it’s a possibility we all need to entertain.
This chart from GS shows the US fiscal easing measures to date compared to those of the last crisis.
- Much of this spending has already taken place but we can rest assured that plenty more will be coming down the pipe. I don’t think there’s a single hawk left within a 1,000 miles of D.C.
- Last one on the fiscal side. US federal debt is set to take out WW2 highs within the next couple of years.
- All this money flooding the market has a lot of people talking inflation. BofA writes that “like stagflationary 1970s we see clustered, volatile, low real & nominal returns coming decade, higher volatility, weaker US dollar; we also think deflationary drivers of excess debt, aging demographics, tech disruption to fade; QE to MMT, globalization to localization, Wall St. capitalism to Main St populism via Keynesianism, central bank subservience, trade/capital/wage controls) means inflation hedges must be sought by asset allocators via real assets over financial assets, long gold and small-cap value, volatility.”
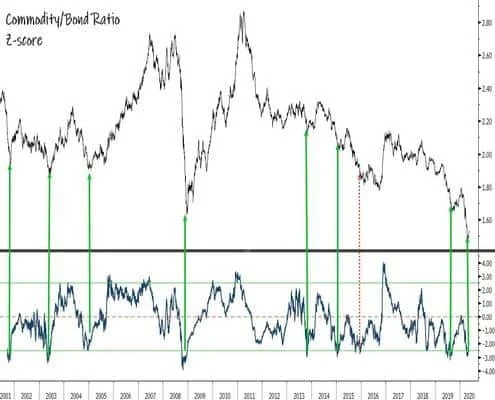
- On that note, a good indicator of inflation, the commodity/bond ratio, recently hit 3std oversold. Typically, when the ratio hits these levels it tends to mark an intermediate to long-term bottom (green lines below show past signals). And a rising commodity/bond ratio means rising inflationary pressures.
- Here’s some info for you homeowners. BofA points out that the “long term history of the spread between the 30y mortgage rate and the 10y treasury yield. The average is 175 basis points versus 262 basis points today. If the spread normalizes, as it typically does after a refinancing wave, and treasury yields remain relatively stable, this suggests the 2.5% area for the 30y mortgage rate is a possibility in the next 3-6 months.”
- DB shared some good charts outlining the bullish gold case over the weekend.
- Over the last few weeks, I’ve been pointing out the lackluster sentiment despite the vertical rise in the market. The recent BofA Bull&Bear indicator is case in point. It’s nailed to zero… This bearishness is fuel for the trend up.
- From that same BofA report, here’s the notes on investor sentiment/positioning. Summary: Consensus is bear market, no V-shaped rally, and tidal wave of flows into cash...
- Finally, here’s the Asset Quilt of Total Returns for the year. We have gold up on top with USTs right behind them. And commodities and MSCI EAFE bringing up the rear. I would not be surprised if this relative performance completely flips by year’s end.


