I’M NOT SHORT ENOUGH STOCK…
***The following is an excerpt from my Weekly Market Prep note and chart pack sent to Collective members every Sunday. If you’re interested in learning more about our premium research service, click this link here. We’re running an enrollment period that will go until Sunday. Hit me up if you’ve got any questions***
Does your positioning match your views?
Mine don’t… And that’s a problem.
I was asking myself this question throughout the week when the market was selling off, and our portfolio was selling off even more.
Sure, we’re still mostly in cash (roughly 60%). And our nominal net market exposure is only around 20%; if you account for our uncorrelated futures and forex positions (long wheat and USDCNH) and then net out our Nasdaq short.
But even this low nominal exposure can be deceptively risky if the names you hold are high beta, especially in risk-off environments, which a few of ours are.
There’s a constant balancing act in this game where one has to try to position according to their base case views but also harmonize across other possible outcomes. Not to mention a certain level of portfolio volatility is just the cost of doing business — the key being you know how high a costs you’re you’re willing to pay, and then play accordingly… All of this is made more challenging when the environment is noisy, and the cone of probabilities is wide (read: conviction is low) like it is now.
And then there’s the matter of path dependency and competing timeframes, which we discussed in A Bunch Of Plonkers… This is what makes managing in the current environment feel like a high-wire act through a hurricane.
I still lean bullish over the next few weeks. But my confidence in that path drops every day the market sells off, and bonds fail to catch a bid. There’s a good chance we’ll have to get through this week’s FOMC first before participants are willing to step in and buy.
But I’m not anchoring too much to any opinion in the short-term. I’ve learned that when uncertainty is high, it’s usually best to overweight against your longer-term view (ours being that we’re in a cyclical bear).
Stanley Druckenmiller gave a talk recently at my former employer, Palantir Technologies (here’s the link). He and PLTR CEO Alex Karp talk geopolitics and markets.
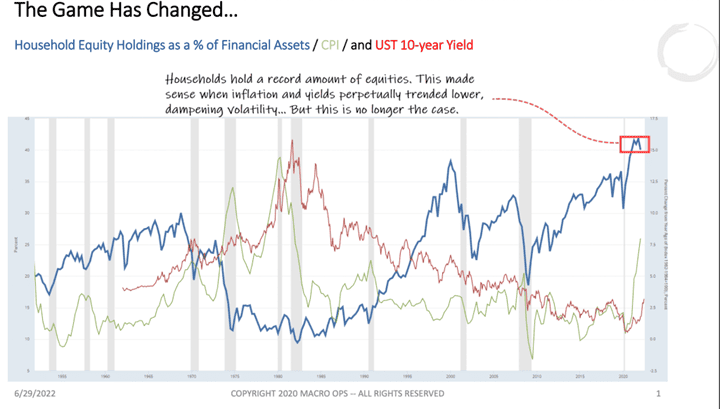
Druckenmiller says he thinks markets have likely entered a decade-long sideways volatile regime, similar to the late 60s through mid-70s. We briefly touched upon this idea in The Game Has Changed…where I shared the following chart showing CPI, 10yr yields, and Household % allocation to equities.
I’m not much into making big macro predictions, as I prefer to just play the odds... With that said, a decade of sideways chop and vol would be in line historically with where we sit in both our long-term debt and policy cycles.
It’ll all come down to how inflation plays out from here. Are we in a new inflationary dynamic? Will regionalization and reshoring, increasing conflict and climate change, and new populist-driven labor versus capital dynamics place us in a secularly sticky inflationary regime? Or will debt, demographics, and technology pull us back to the low inflationary world we know?
I can make arguments for both, though I lean towards the former. And it’s not entirely an either-or. Whatever unfolds will be a dynamic process with lots of cycling back and forth.
It is clear, though, that we’ve crossed the chasm into some new kind of regime. One that will continue to show its colors as it develops and unfolds from here.
The power of fiscal policy has been (re)discovered. Politicians are unlikely to put that tool back in the box anytime soon. And geopolitically speaking, I’d wager that the trend over the next decade isn’t towards more peace and cooperation.
Dalio wrote in a recent note (link here) that he expects CPI will stay quite sticky over the coming years. He writes:
Right now, the markets are discounting inflation over the next 10 years of 2.6 percent in the US. My guesstimate is that it will be around 4.5 percent to 5 percent long term, barring shocks (e.g., worsening economic wars in Europe and Asia, or more droughts and floods) and significantly higher with shocks. In the near term, I expect inflation will fall slightly as past shocks resolve for some items (e.g., energy) and then will trend back up towards 4.5 percent to 5 percent over the medium term.
Zeus knows whether Dalio will be right and, if so, for how long. But it seems a reasonable take to me and a potential outcome worth exploring.
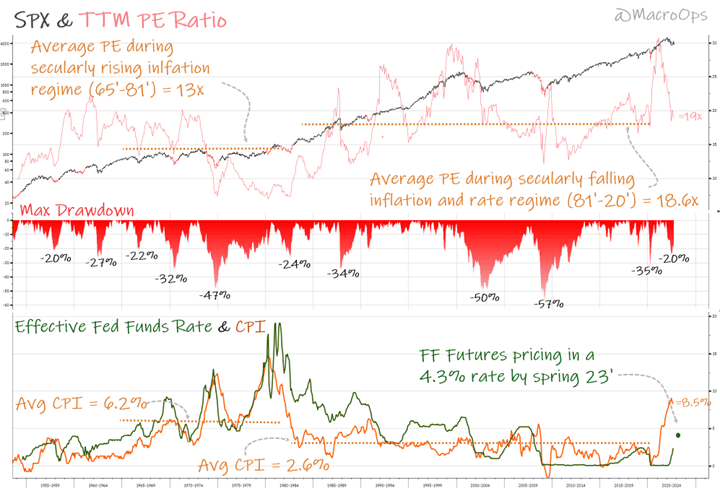
Here’s a busy chart I created. It shows the SPX (black), its TTM PE ratio (light red), its average PEs for both rising and falling inflationary regimes (rust-colored dotted lines), and the CPI (orange line) and Effective Fed Funds Rate (green line).
A higher inflationary regime would necessitate a higher equilibrium for interest rates. And since markets are a relative game and pricing works through risk-premia spreads. Higher rates equal lower average multiples on stocks.
The high inflationary regime that persisted from 65’ into 81’ saw an average market multiple of 13x TTM PE. While the most recent secular period of declining inflation and rates has had an avg PE of 18.6x. The current TTM PE is 19x.
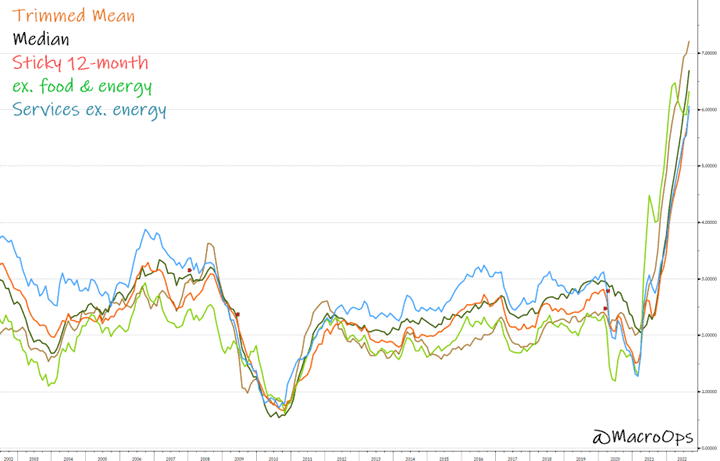
Fed funds futures are currently pricing in a fed rate of 4.3% by Spring of next year. Ballpark, this feels about right considering where the labor market and wage growth are. Not to mention, the inflation print last week showed that everything the Fed had been citing as important over the past year, is hitting new highs (see chart below).
This tells me that we can ignore the Pollyanna’s calling for a coming Fed shift. It ain’t happening… Not anytime soon.... Yes, CPI will continue to fall. But the Fed is not going to directionally change course on rates until CPI is back at target for “some period of time” or until the markets really break…
There will be no “soft landing”. There will be lots of upside and downside vol over the coming months. We could very well run 20% higher here in the S&P. That wouldn’t be out of the ordinary for a cyclical topping process.
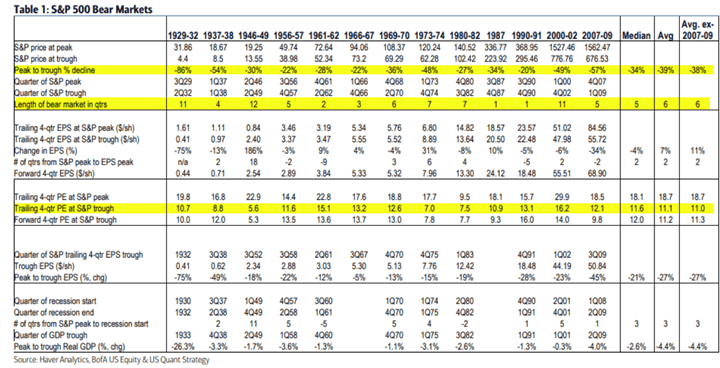
We could also just as easily drop another 20%+ from where we are. This is what I expect we’ll see at some point over the next 12 months. And this would be right in line with the average bear market, which is a -39% drop from peak to trough, a bear cycle TTM PE low of 11x (we’re at 19x today), and average duration of six quarters (we’re three quarters into this one).
These are best-case scenarios, in my opinion. Because if we just look at the stats during the higher inflationary periods, then the average PE trough is, in fact, much lower.
The Generals are always the last to go… But when the mighty fall, they fall hard…
On Slides 12 and 13 I lay out the technical and fundamental case for why the OG FAANMG stocks are headed much lower, and why these will be driving force behind the next major leg down in the broader market …
***End of Excerpt.****
Note: Enrollment into our Collective is running into the end of the week. The Collectiveis our full-kit soup-to-nuts service that provides research, theory, and a killer community that consists of dedicated traders, investors, and fund managers from around the world. We’ve been told that there’s nothing else like it on the web. If you’d like to tackle markets with our group (whom, I should note, has been having a great year in markets), then just click the button below and sign up. And, as always, don’t hesitate to shoot me any Qs!***


