Dance Like It’s 1970, Baby
Today we’ve got a guest post from Srivatsan “Sri” Prakash. Sri is the 18-year-old host of the Market Champions podcast dedicated to interviewing the best and the brightest in finance and economics. His thoughts can be found on Twitter @SrivatsPrakash.
Please enjoy …
Everyone’s comparing today’s inflation to the type experienced in the 1970s. The work of Alan Blinder on the inflation of the 1970s is one of the best, and I’d highly recommend you give it a read. You can find his paper, The Anatomy of Double-Digit Inflation, here.
What went on in the 1970s?
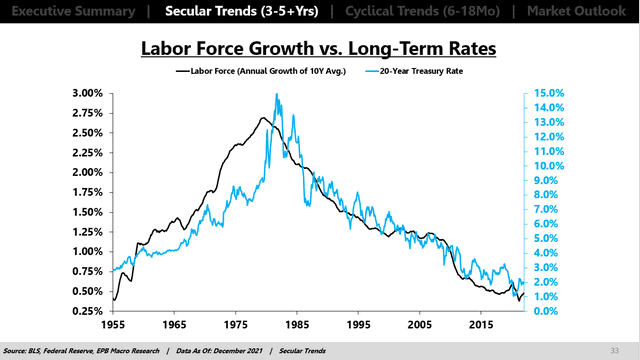
What happened in the 1970s? Demographic changes caused much of the 70s inflation, broadly resulting in higher demand for goods. We saw the entry of the baby boomers, women, and minorities into the workforce in the late 1960s and early 1970s.
(Source: Eric Basmajian)
Most of the inflation in the 1970s can be attributed to changes in the labor force. Young entrants to the labor force require capital for simply working at their job (e.g.,. tools, suits, etc.) and for living (apartments or houses, cars, dishwashers, TVs, etc.). They also need job training, etc. New employees rarely have a positive return in the first few years and typically end up in debt financing.
This comparison to today is interesting because we’re seeing the complete opposite phenomenon occur. We’re seeing the labor force's growth rate slow, not speed up. We simply haven’t seen a baby boom any time earlier.
Where it does become interesting is to think of general demand dynamics. Demand has risen simply through lump sum payments to people, higher savings rates, etc., which has undoubtedly affected inflation. This did expand the consumption function of aggregate demand, and a lot of this poured into purchasing durable goods - like washing machines, refrigerators, TVs, etc. Yet, the broad difference remains that demographics are not playing the role they did in the 1970s.
Energy and Food Shocks
Here we begin by consulting some of Blinder’s previously mentioned paper. The United States and most of the developing world went through a patch of bad weather, broadly disrupting the food supply around the globe. This led CPI for food to rise by 20% in 1973 and 12% in 1974. Interestingly, there’s a broad parallel between then and now regarding the influence of energy and food prices.
The 1973 inflation including food and energy was a whopping 5.7%, yet when you exclude energy and food, it’s <2%. We see a similar dynamic in the United States today. The YoY CPI inflation rate was 9.1% in June, while the YoY Core CPI inflation rate was just under 6%.
The importance of food price increases in driving inflation may be understated, as we may have a 2-way feedback loop between wages and food prices (higher food prices being reflected in higher wages, which may or may not lead to a spiral). Alan Blinder’s work suggests that in the 1973-75 period, about 5 percentage points of inflation was caused by food prices.
The second significant shock in the same period was the 1973 energy shock, where the OPEC cartel allowed the price of imported oil to quadruple within a few months. Blinder’s work suggests that roughly 2.4 percentage points of inflation can be attributed to oil price increases during this period. The 1970s became very interesting because in the mid-1970s, inflation disappeared “by itself.” Yet, in the latter half of the 1970s, we saw a second bout of inflation. The food shock of the late 1970s was similar in cause, although the increase in food prices was 22% in the late ‘70s vs. 29% in the early-mid ‘70s. Broadly, much of this inflation was driven by meat price dynamics, stemming from drops in cattle population (over 16%, the largest ever in American history).
Similarly, severe weather disrupted animal feed production, etc., leading to the dissolution of any substitution effects (through increased poultry and pork production). As is a famous topic in history, the late 1970s also saw the Shah of Iran abdicate.
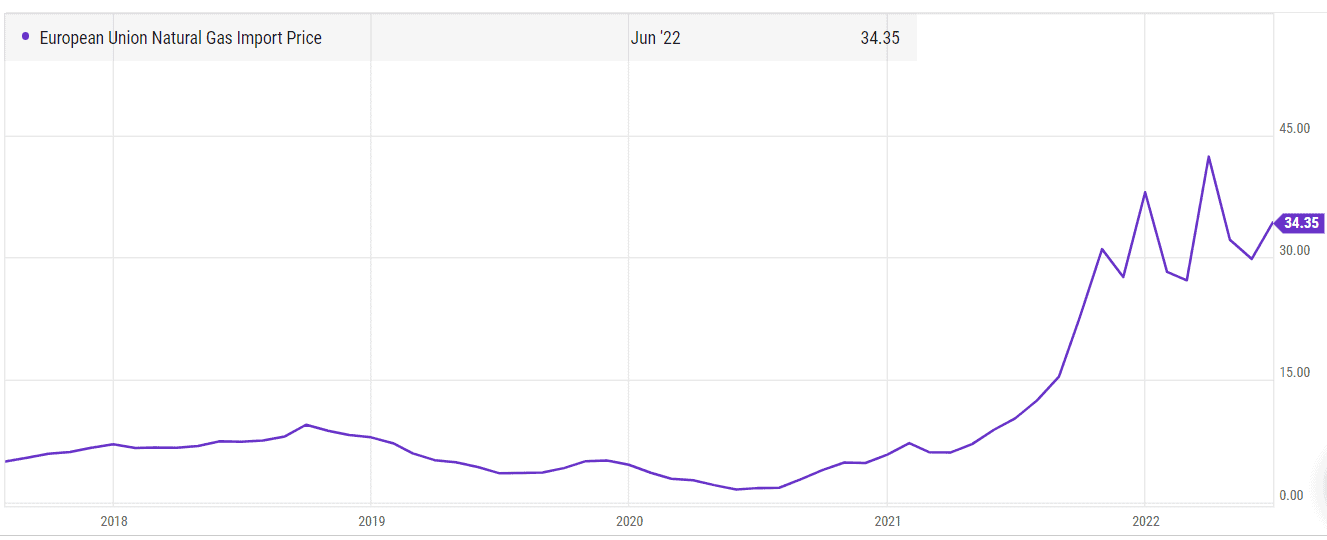
Now, this bears many similarities to the dynamics in place today. The large underinvestment in oil production, among other significant commodities, has led to price spikes. Similarly, we’ve observed supply shocks develop both in the food and energy markets. It’s essential to remember that Russia and Ukraine are large suppliers to grain markets. Russia is a big fertilizer producer (producing about 50-65% of the global ammonium nitrate supply). Similarly, Russia contains many supply chains for energy, especially in Europe.
Here’s what’s happened to EU Natural Gas prices:
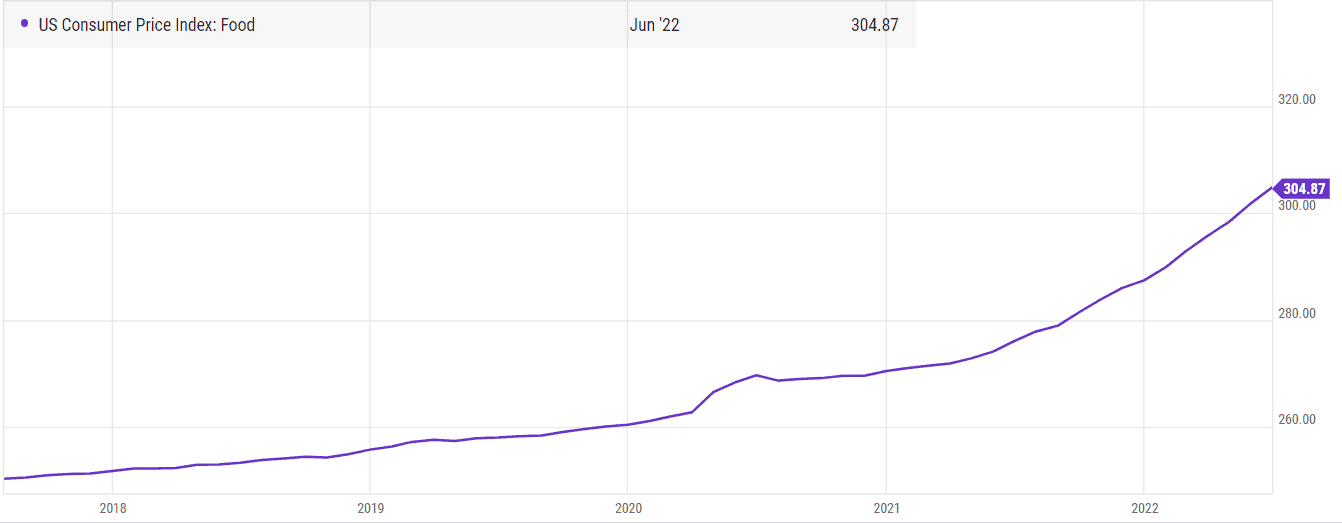
Similarly, we can observe a rapid increase in food prices in the US. In June ‘21, the index was at 276, while presently, it’s at 305, which is a 10% or so increase in food prices YoY!You can observe this in the chart below:
Price and Wage Controls
The last aspect of the 1970s worth discussing is the policy changes. Nixon’s price and wage controls were broadly responsible for the inflation of non-food and non-energy goods. This was the US’s first and only attempt at running a wage-price control policy in peacetime when Nixon announced his 3-month long “freeze” in August 1971.
Blinder’s work shows that these policies caused inflation to be lowered during periods of low inflation and elevated during periods of high inflation - this increased the role of “catchup” inflation, which increased inflation in the 1973-74 period after a lull in 1972.
This phenomenon is simple to understand - the controls temporarily cause prices to remain stable for some time. So if under no control, the cost would’ve risen by 10% annually (for two years, it would go from 100->110->121). This turned into the price jumping from 100 to 121, a rise of 21% in one year instead. These, while not as directly crucial as food shocks, still help accentuate the level of inflation in the 1970s.
Does this dynamic hold a parallel to what we see right now? Not directly. We’ve started seeing the beginnings of government policy, trying to find a solution.
Also, a significant cause of today’s inflation woes is driven by supply chain blockages, which didn’t directly exist in the way and cause that they exist today. To conclude, today’s inflation appears to be a lot more idiosyncratic, and it seems different compared to what we experienced in the 1970s. Any comparison to the 1970s (or other inflationary periods) should be taken with a grain of salt - just as there are always parallels, there are always differences.


