Cashless Earnings… [Dirty Dozen]
Opinion is like a pendulum and obeys the same laws ~ Arthur Schopenhauer
In this week’s Dirty Dozen [CHART PACK], we look at the structural changes to inflation drivers, discuss why market leads should give pause to the bears, look at poor earnings quality, recession risk in Europe, and a short setup in Ags, plus more…
**Note: Last month we gave you a look at the new HUD software tools we're using to make our global macro strategy more profitable and efficient.It was exciting to see the positive response, but many of you were wondering how it all fit within the MO Collective subscription.That's why over the next two weeks we'll show you how the different parts of the Collective work together to give you an edge in your investment process. This week:
We'll review the market’s geopolitical narrative with a focus on risk.
We’ll show you how we used our macro process to capture one of the biggest winners last year and how we're preparing for another long set up this summer.
You’ll get an in-depth presentation from one of our Collective members that dissects the copper industry and explains why there’s a massive bull trend forming.
If you want to take advantage of our community and all the new tools we've added this year, make sure you sign up for the Macro Ops Collective.**Enrollment opens next week on Monday, March 20th. Don't miss this opportunity to optimize your investing strategy before Spring.You can learn more about that Collective and what it can do for your investing, here.
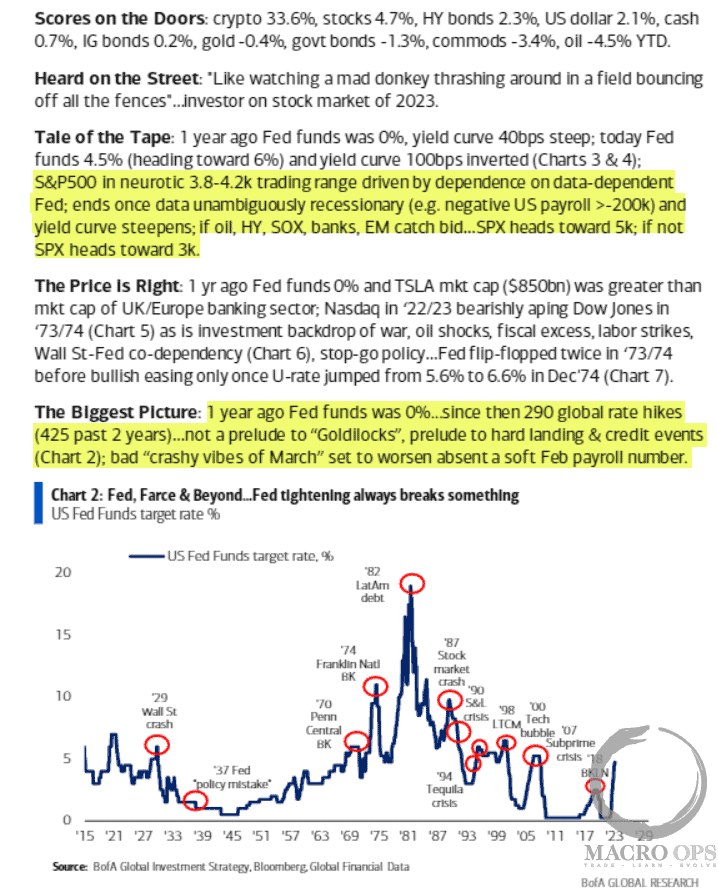
Flow Show summary… I’ve been finding myself in agreement more often than not with BofA’s macro take these past few months (highlights by me).
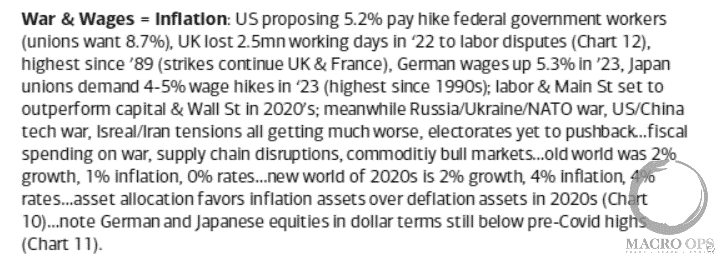
A bit sticky… We at MO are of the mindset that we’re in a new secularly higher inflation regime, due to structural, demographic, and geopolitical trends. This bit from BofA summarizes some of these.
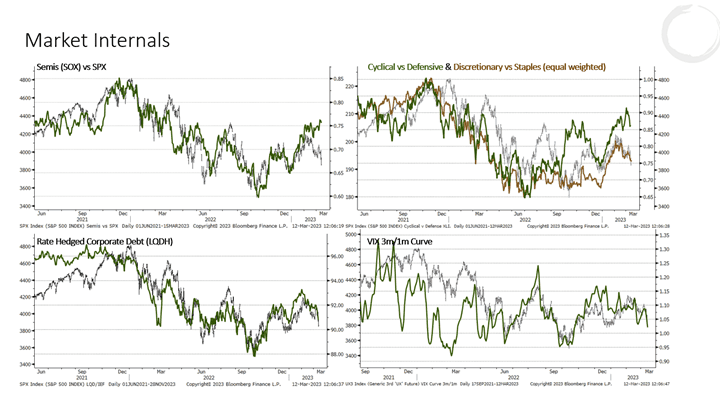
Leads aren’t bad… Sentiment and positioning remain very depressed. There’s a good chance last week’s SIVB freakout marks a near-term low. I keep returning to market internals, such as Cyc vs Def, Semis v SPX, etc… and none of these are leading to the downside. They’re either leading up or trading in line with the market. That’s not exactly bearish.
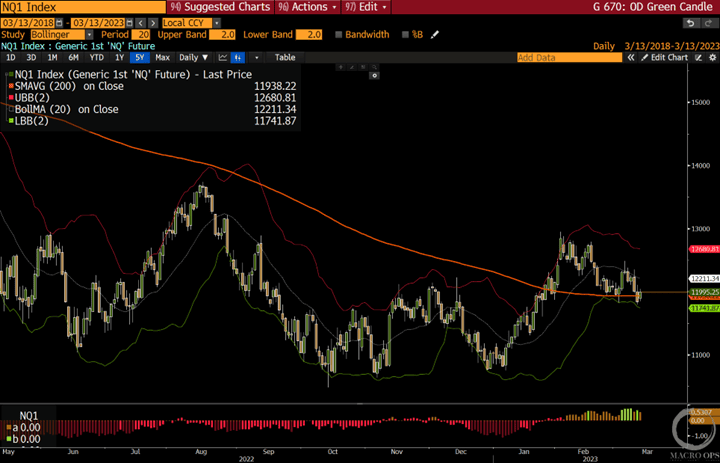
A bit constructive… The Russell chart is broken but that’s just because of the kneejerk reaction in financials last week following the SIVB news. It’ll be important to see if IWM can retrace that damage this week.
But Qs and SPX remain constructive as long as they can hold their current levels.
Anecdotally, last week I started receiving texts and calls asking about a potential market crash from friends I don’t normally talk markets with. It seems to me that the bearish hysteria doesn’t quite match the tape.
Flimsy profits… I found this stat from BBG interesting. Apparently, the SPX’s operating cash flows trail profits by the “most on record.” BBG’s Lu Wang points out that “income at SPX companies, adjusted for amortization and depreciation, topped cash flows from operations by 14% in the year through September… In other words, for every dollar of profits, only 88 cents was matched by cash inflows, the largest discrepancy since at least 1990.”
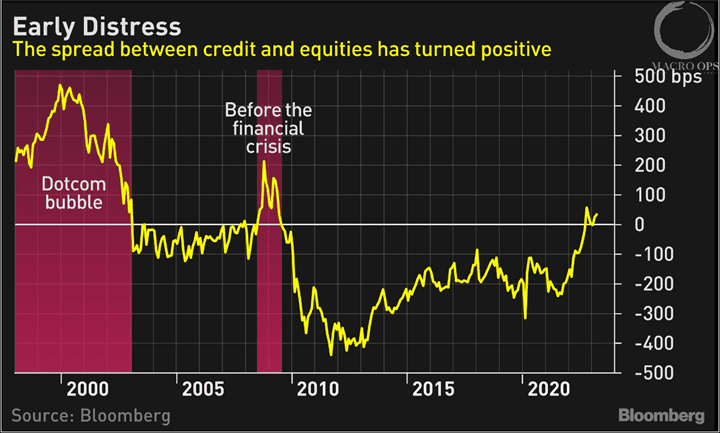
Positive spread is a negative thing… The spread between BBB credit and equities is now positive with the SPX sporting an earnings yield of 5.4% compared to that of IG bonds which yield 5.7% on average.
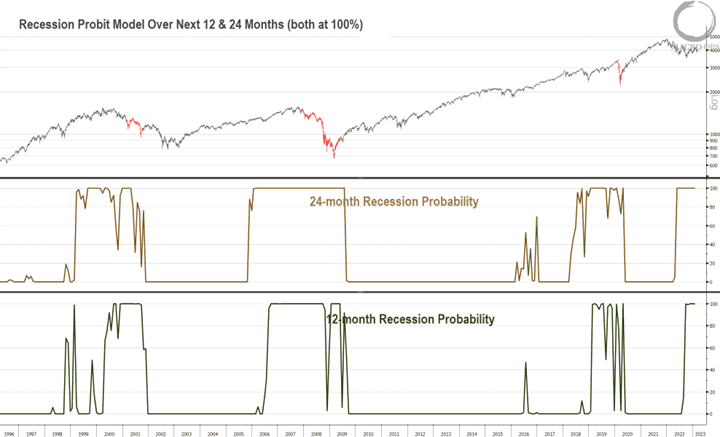
A toxic mix… Our macro environment can be summed up as thus: aggregate US valuation metrics in 88th percentile + resilient US economy forcing an aggressive Fed to stay aggressive + deteriorating fundamentals = a recessionary hard landing later this year due to monpol lags and positive feedback loop nature of labor market unwinds.
This is why we remain long-term bears even though we currently lean bullish over the short-term.
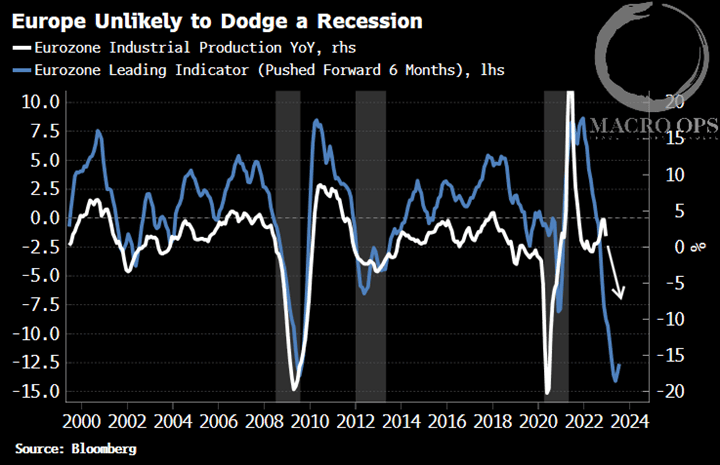
Europe is unlikely to get lucky… This chart from BBG’s Simon White shows a composite of economic leads (blue) and eurozone industrial production (white). This indicator typically has a 6-month lead.
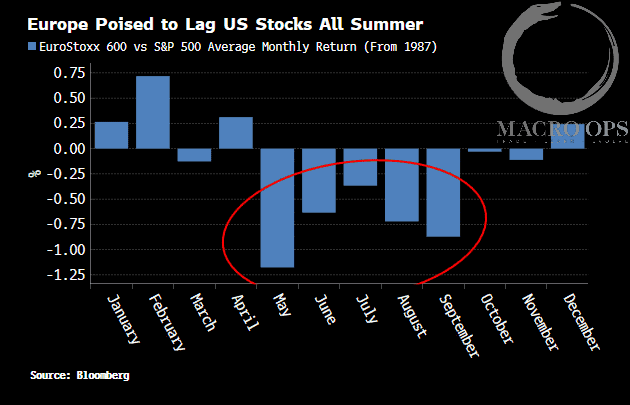
Seasonably bad… And as White goes on to note, the summer tends to be quite poor for European stocks relative to the US.
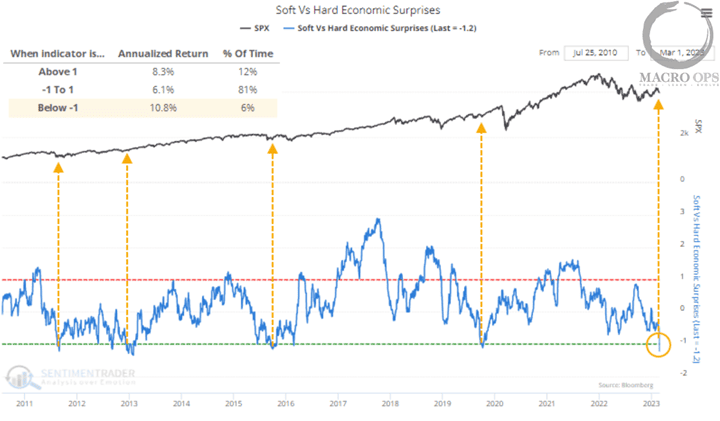
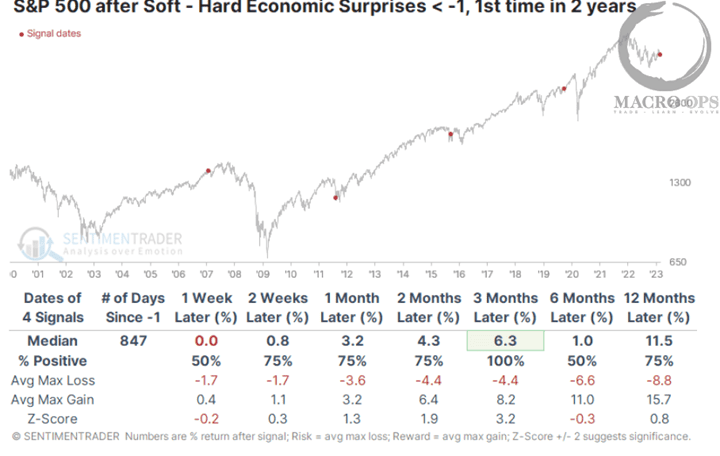
Soft vs hard… SentimenTrader pointed out last week that the US soft vs hard economic surprise spread is historically depressed.
Small sample though… ST writes “after the spread fell below -1 for the first time in years, the S&P's returns were good. Of course, we must discount any potential conclusion because of the minuscule sample size. So, for what it's worth, the S&P sported a positive return each time over the next three months and didn't suffer any consistent losses up to a year later.”
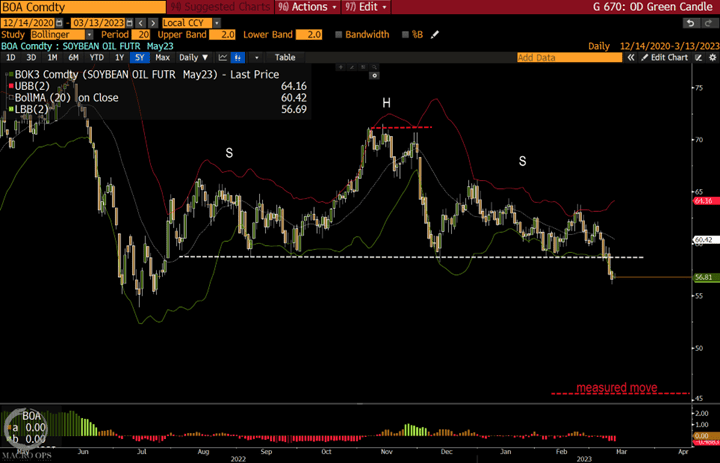
Soybean oil short… Soybean oil has completed a large H&S pattern. The measured move target for a short trade is noted on the chart.
-**Note: Our team is currently fine-tuning our tools and strategies for the 2023 Macro Regime Shift.If you're looking to optimize your portfolio and take advantage of a global macro strategy, then enroll in the Macro Ops Collective. The enrollment period opens next week on Monday, March 20th and will remain open until Sunday, March 26th.The Collective is our premium service that offers institutional-level research, proprietary quant tools, actionable investment strategies, and a supportive community of dedicated investors and fund managers from around the world.Learn more about the Collective and how it can benefit your investing here.And if you prefer to talk to us directly, you can schedule a free consultation call by clicking the link below:Click here to schedule your call.-Thanks for reading.Stay frosty and keep your head on a swivel.


