A Mutant Selling Deformity…
“The more humans try to be half-gods, the more they become half-monsters.” ~ Nassim TalebTaleb’s “half-monsters” quip is in reference to a point he made about modern-day Olympians and how systematic overoptimization had corrupted the original spirit of the contest. He went on to write:
“There used to be a distinction between an athlete representing virtus (humanness) and arete (the quality of being what you are made to be) on the one hand and, on the other, the circus acrobat selling uniqueness and deformity. Mediterranean ideals, as opposed to the Egypto-Babylonian ones, were about scale and balance: even the Gods were brought down to human scale. … Today’s Olympics, by dint of specialization and overoptimization, thanks to the media and the huge financing involved, have transformed the athlete into a circus acrobat, a mutant selling deformity.”
This, I believe, is a great analogy for so much of what ails markets and the world today…We’ve optimized, specialized, and reduced our world to a point of complete incoherence. We’ve created half-monsters out of the systems that guide our lives, the environment in which we live, and as a result, ourselves. We’re suffering the inevitable consequences of bastardization by overoptimization…
Because of these many bridges too far…
We are sicker, less happy, dying younger. Our global economic system of trade and finance is strained and breaking apart at the seams. Our financial markets require constant intervention from our policymakers to keep them functioning…
How did we get here?
Or, more importantly, why did we get here?
What conditions, constraints, and incentives propagated this Gordan Frankenstein?
And most importantly, how do we remove ourselves from the miseries of our own creation?
We’re going to explore this line of questioning in a series of pieces over the coming weeks.
We will approach this problem from a number of vectors, including investing and markets, trade and the global economy, health and the medical system, war and geopolitics, incentives and the political system.
The hope of this intellectual journey is that we can come to better understand where we collectively stand by effectively identifying the characteristics of each vector and the dominant drivers behind their propagation. And once we know where we stand, we can then discuss where we may be headed.
This exercise isn’t meant to be overly philosophical. But rather practical, yielding actionable insights that will both guide decision making, as well as open up and inform our world view.
In today’s piece, we’re talking investing and markets.We’ll begin with ants.
Exploration versus Exploitation…
Do you know how large ant trails form?Ants randomly distribute in search of food during a period of exploration. When they find food, they return along the same path, laying down a trail of pheromones everywhere they go. This is how they communicate.
The more they walk a path, the stronger the pheromone trail becomes, and the more ants follow it. This creates a feedback loop that leads to a period of exploitation, where the ants fully consume the food at the source.
What’s fascinating is there’s an embedded probabilistic distribution in how ant colonies balance exploration versus exploitation. Michael Mauboussin has explored this analogy in a research paper on why some companies survive, and others fail, titled Corporate Longevity: Index Turnover and Corporate Performance. Here’s an excerpt from an interview he did on the topic (link here).
If you actually watch ants in your backyard in the summertime, they’re kind of doing crazy stuff all the time. The scientists were studying them, and they would find out that some ants would just peel off of the pheromone trails that lead to the food source. Then they got much more scientific about studying that rate of peeling off and it turns out there’s a mathematical probability.
Here’s the thing that’s absolutely beautiful. This is the thing that’s so cool. It turns out that the probability of peeling off the path is in fact a function of the rate of change in the environment. So when the environment does not change rapidly, the ants go for mostly exploitation and very little exploration.
When the rate of change is rapid, they know that the food source may be exhausted quickly and there may be other food sources that are popping up around them. They’re going to allocate more resources towards exploration…If you go to ecosystems in our world today, there are some environments that are extremely stable, and you’ll see almost all those species are all about exploitation. They do very little exploration. You’ll find other ecosystems that are rapidly changing. You’ll see the species there that adapt are very big explorers. They do very little exploitation per se. Then there’s everything in between.”
Two fascinating points about this natural intelligence. One is how these social insect systems organically create balance between exploitation and exploration. And two is how the system naturally adjusts to the variability of the environment.
If the ecosystem is one of high variability, the ant colony will allocate more time to exploring. If it’s a boring environment of abundance, they’ll focus on exploitation. The system self-organizes for efficiency and adaptability.
Now, there are obvious parallels to these two points and financial markets, and not just in the example of index turnover that Mauboussin uses.
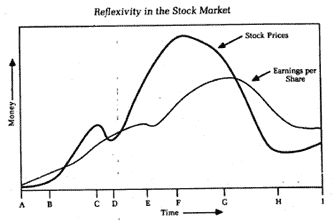
Like a large pheromone-laden ant trail, the best trends in markets are comprised of reflexive feedback loops. These feedback loops work on technical, behavioral, and fundamental levels.
Trend following and momentum are known factors. They work in generating excess market returns over the long term. A market trend is literally the active conversion of bears to bulls, non-believers to believers, or explorers to exploiters — market participants falling in step on a trail of pheromones.
This conversion process to exploitation often overshoots what can fundamentally be sustained, as the inherent feedback loops engender herding and the technical trend develops a momentum all its own that’s well beyond that of the underlying fundamentals. This causes an overshoot and the formation of mispricings and occasionally large bubbles.
This is how stability breeds instability. And why every trend contains the seed of its own destruction, to quote John Percival. Investors, inevitably, overoptimize for the recent past. Conversely, they overextrapolate what’s worked. This makes them incredibly fragile to a variant future. In fact, this overoptimization/exploitation is what necessitates the vastly different future…
Every bubble has two components: an underlying trend that prevails in reality and a misconception relating to that trend. When a positive feedback develops between the trend and the misconception, a boom-bust process is set in motion. The process is liable to be tested by negative feedback along the way, and if it is strong enough to survive these tests, both the trend and the misconception will be reinforced. ~ George Soros
Systems without negative feedback loops tend to snuff out variability and push risks to the tails. This gives the appearance of stability over a period of time. It doesn’t extinguish volatility; it just temporarily suppresses it. Which perversely ends up increasing systemic fragilities, laying the bedrock for higher volatility in the future.
Let’s bring this down to the brass tax. What does this mean for us, and how can we use this information to make money?
Passively concentrated…
Fortunately, our current market provides a perfect case study in overoptimization. Overoptimization has led to overextrapolation, which, with the absence of negative feedback loops, has created a mutant. And this mutant houses incredible risks…
Here are the facts.
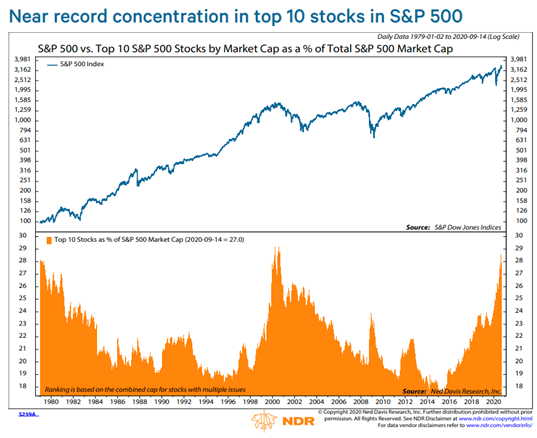
Just ten stocks comprise nearly 29% of the S&P500. The only other time in history it’s been higher was at the top of the dot-com bubble.
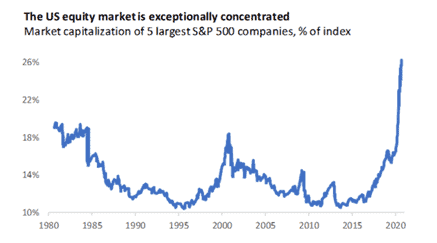
If we narrow it down to just the top five companies by market cap in the S&P, it hit an all-time record high of 26% in 2020 ( I recognize these two charts are almost 2-years old, but I didn’t feel like creating my own updated version as the data hasn’t changed significantly) (chart from Advisor Perspectives).
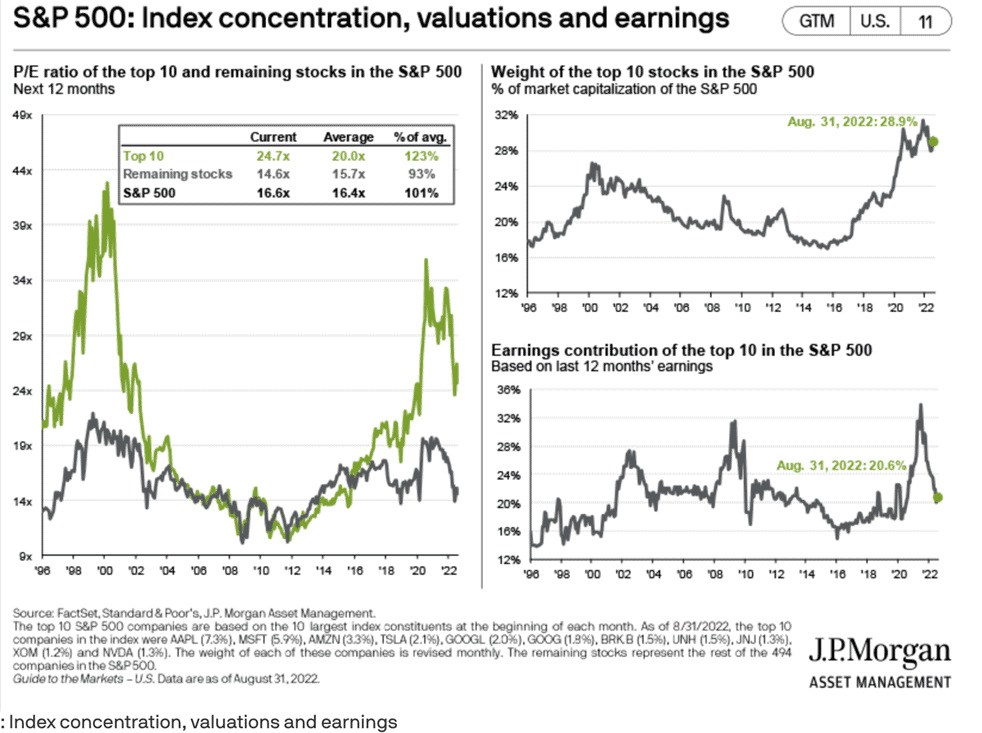
This chart pulled from JP Morgan’s most recent Guide To Markets shows the forward PE ratios for the Top 10 stocks by market cap in the SPX is 24.7x, which is 23% above its 20-year average and well above the market’s forward PE of 16x.
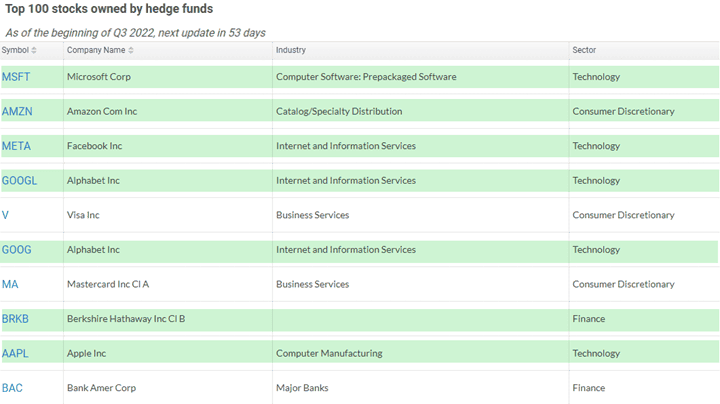
Not surprisingly, these mega-caps are also those most owned by hedge funds. Trends drive herding, which drives overextrapolation (i.e., rationalization of elevated multiples), which leads to crowding, which breeds instability (source: HedgeFollow).
None of this is particularly unique. It happens every cycle. Though the thing that never fails to humor me is how convincing and intelligent sounding the narratives are near the end of these trends. By necessity, they have to be… That’s how these large concentrations (herdings) develop.
Google’s, Apple’s, Meta’s, etc…. moats are insurmountable… the internet has reversed competitive dynamics… they’re so cheap relative to their 5-year history… we can use these equities as bond-like instruments since their cash flows are so predictable, yadda, yadda, yadda…
Titanfall…
Now, maybe this time will be different, and some or all of these companies will still dominate the indices in another ten years' time. That’s fine, and I’m open to that possibility. But at MO, we don’t bet on possibilities. We bet on probabilities. And so we care about things such as historical precedent and knowing what the base rates are.
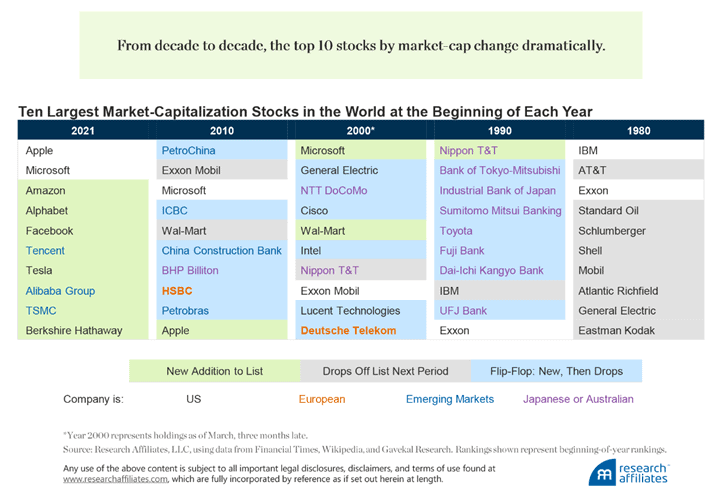
And there’s not a lack of research that shows a high turnover of index leaders is the norm. This paper from Research Affiliates titled The Fall of the Titans discusses just this point. The below chart shows it’s quite rare for a stock to maintain its top 10 status for over a decade.
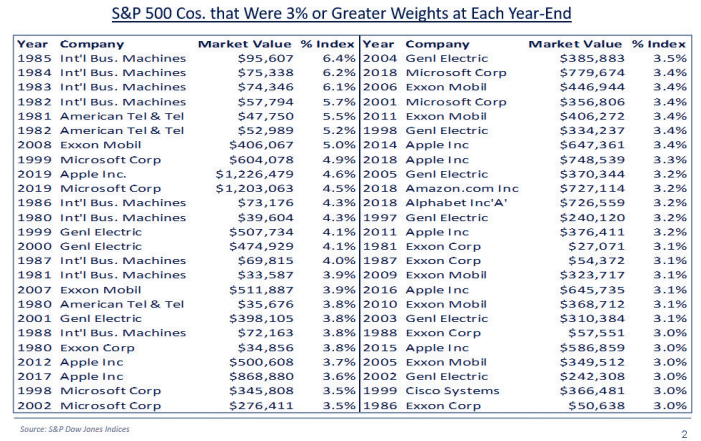
The investment firm Horizon Kinetics published research on index concentration and forward returns a few years back. Here’s the paper, along with two graphs that help make my point.
This table show every stock that achieved over a 3% weighting in the SPX by year’s end, going all the way back to the 1980s.
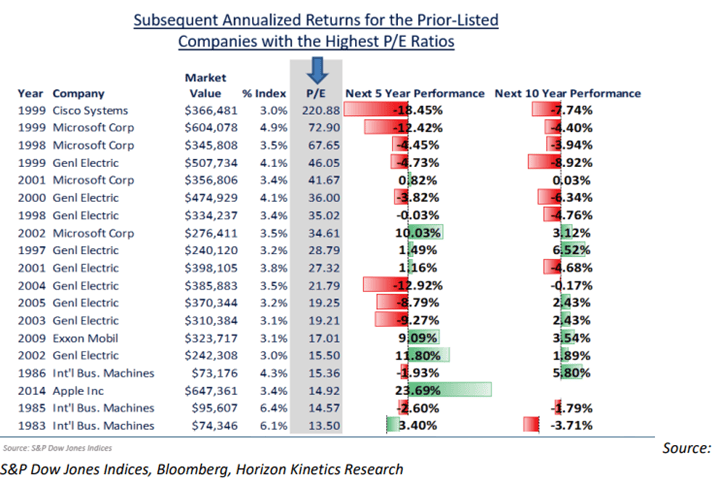
This one shows the same names but in descending P/E order along with their subsequent 5-and 10-year returns.
Look at that list... Only three companies saw positive double-digit 5-and 10-year annualized returns. Microsoft, Google, and Apple. And these returns were on the back of the secular rise of the internet. The onboarding of 5.03 billion people onto the web, or roughly 65% of the global population.
That’s quite a tailwind. A tailwind that is highly unlikely to persist for the next 10 years. These companies now find themselves up against the law of large numbers and victims of their own incredible success.
Read this excerpt from DigiDay, which explains in stark terms the dominance these companies hold on the global advertising market.
Google, Meta (formerly Facebook) and Amazon have never been so powerful.
Together they accounted for more than $7 in $10 (74%) of global digital ad spending last year, which is 47% of all money spent on advertising over that period. That put them on track to reach a dominant share of the entire advertising market this year.
It’s impressive, the power of these big tech firms, it really is. But this is old news. This has long been baked into the price. At current growth rates, Meta and Google will control 95%+ of the entire global digital advertising market within a couple of years.
The problem then is where do the next ten years of growth come from? The global ad market grows at 3% annually, which is below even current inflation. That’s not a very sexy story to tell.
Apple has juiced margins through price hikes about as much as is likely possible and is now turning into a bank. Amazon gets over 70% of its operating income from AWS, where it already has a 30%+ market share in an increasingly competitive space. Tesla is, well, Tesla… need I say more?
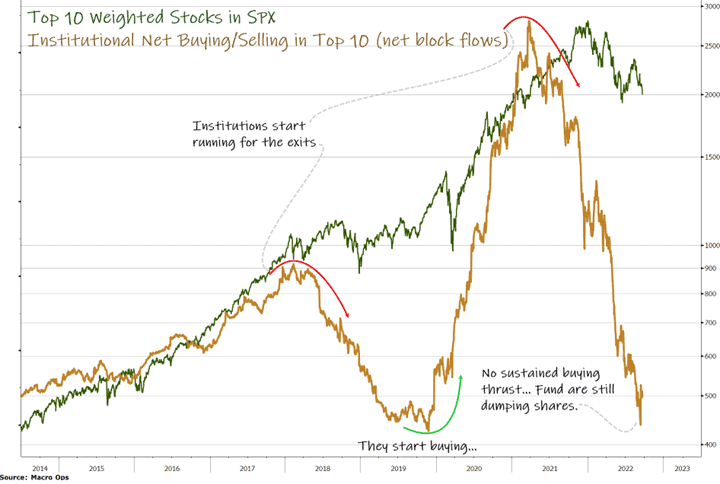
Base rates, the law of large numbers, and a changing regime suggest the future will be quite different for these behemoths. Funds, who again, have crowded into these names over the past decade, have been quietly running for the exits. Here’s the netblock order flow for the top 10 weighted stocks in the S&P.
Here’s why this matters, even if you’re not invested in these names.
These are the Generals of the regime. The Generals always get shot last. But when they fall, they drag the whole lot (the indices) down with them.
And when concentration is at extremes as they are today. This risk is even greater.
Remember, just five stocks account for 26% of the entire S&P 500 index. Apple and Microsoft account for over 50% of the information technology sector. Google, Meta, and Netflix account for 40% of the Communication Services sector. Amazon 29% of Consumer Discretionary.
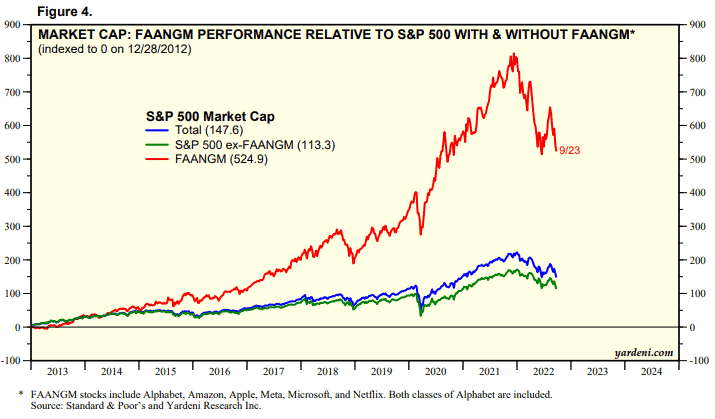
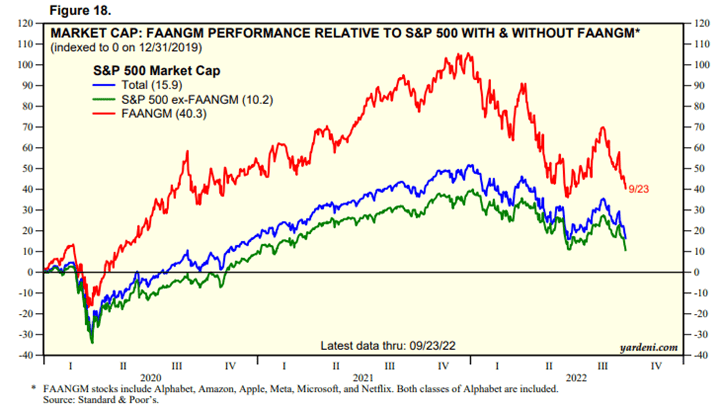
These stocks have been the primary driver of index returns over the last decade by a wide mile. What happens if these stocks start dragging on the index instead of driving it?
There’s something unique about this cycle, and that’s the advent of passive indexing. Indexed assets surpassed half of all available investment assets as of a few years ago. This means that passive vehicles now exceed the available float.
The secular adoption of passive investing has been a huge boon to the Megatech stocks that attract, by the nature of their market caps, the vast majority of these flows.
This dynamic is complete with numerous positive feedback loops where passive flows dampen volatility, proving a blind bid for increasingly large market caps. This, in turn, has given these companies dominant advantages in attracting and paying talent with inflated stock prices, incredibly cheap cost of capital, and a near limitless ability to buyout out smaller competitors.
What will this process look like if it cyclically goes into reverse? What happens if the future for these businesses begins to look dramatically different than their recent pasts? What happens if we enter a new cyclical regime… perhaps a decade of sideways volatility as Druckenmiller recently suggested? What will that do to passive investment flows, and how will these changes affect the broader market when passive makes up such a significant amount of the available float?
I don’t know, and neither do you. We’ve never been here before. Maybe it won’t be so bad, and maybe it will.
The base rate for where we are certainly isn’t promising. But I’m not interested in predicting, just trying to “imagine alternative scenarios” and come up with “different mental pictures of what the world should be like and wait for one of them to be confirmed” to pull from my favorite Bruce Kovner quote.
We’ve spent a decade in all-out exploitation mode within financial markets. This has resulted in the large herding and concentration into just a handful of dominant companies. Investors have overoptimized for a past that is unlikely to look like the future we’re headed into (as I’ve discussed in The Game Has Changed, A Bunch Of Plonkers, and Positioning = Views).
Mauboussin writes in his older yet terrific book More Than You Know about what happens to Army Ants when they overoptimize:
Worker ants, which are essentially blind, sometimes separate from the colony. Since no individual ant has any idea how to relocate the rest of the colony, all of the ants rely on a simple decision rule: follow the ant in front of you. If enough individuals follow the strategy (i.e., they reach the tipping point), they develop a circular mill, where ants follow each other around in circles until death. One such mill persisted for two days, had a 1,200-foot circumference, and a circuit time of two and a half hours…
Environments with too much overoptimization, exploitation, volatility suppression, etc… create the foundations for their own upheaval, for the nascency of an opposed regime.
So what to do?
Not all ants that get caught in a circular mill march to their death. Eventually, a few workers break away from the herd and create the requisite diversity for the mill to extinguish itself.
We want to be these enterprising ants. The ants focused on survival and exploration. This is why we’re short Nasdaq futures, long a basket of oil and gas names, Ags, uranium plays, beaten down tech, long USD, and holding large amounts of cash (north of 60%).
This year has been a battle and will likely continue to be so. We’re up +14% for the year because we disengaged from the circular herd early. And while we hold high conviction on the long-term path, the short-term poses incredible risks, both to the upside as well as the downside. I’ll be discussing both in this afternoon’s weekly Trifecta Chart Pack.
Markets, supply chains, politics, and our environment have suffered decades of bastardization by overoptimization. We are now moving into a period of greater volatility on all fronts. This volatility will force on us a greater balance. It will bring enormous risks as well as opportunities.
Overanchoring to the past, lack of imagination for what the future can bring, and a poor understanding of the long history of markets and man will be the major detriments and pitfalls to most.
We will work hard not to fall into these traps.
In our next piece in this series, we’ll dive into commodities, global supply chains, and the changing world order.
Until then, keep exploring…


